
How Amazon Handles Business Intelligence
There are many benefits from having data-intensive applications or business operations situated in the cloud. Hardware and software are easier to procure, security is tighter, scaling is easier, and there are plenty of opportunities to save on costs and avoid other pitfalls of cloud-based hardware. Users are provided AWS QuickSight for Business Intelligence more specifically and Amazon EMR for more general big data workloads.
AWS QuickSight
AWS QuickSight is an excellent service for data-driven business operations. It makes it easier to send easy-to-understand dashboards and data visualizations to employees and different levels of an organization with information they can apply to their tasks. Along with some default templates to work with, users can compile custom formats for dashboards using simple click-and-drag functionality. There are plenty of options for how users can embed, implement into APIs, and utilize them in applications. Because this is a serverless tool, it can scale endlessly to encompass tens of thousands of simultaneous users.
Enterprise Workloads
QuickSight streamlines data integration from various sources without needing extra infrastructure, thanks to its blazingly fast Parallel, In-memory Calculation Engine called SPICE (super-fast, parallel, in-memory calculation engine). This engine allows for rapid on-the-fly calculations, enabling users to quickly generate dynamic visualizations that can be tailored and reorganized to meet specific business requirements. This eliminates traditional complexities involved in data preparation, such as manual extraction, transformation, and loading. Moreover, AWS QuickSight offers interactive tools, including graphs, tables, charts, stories, and sheets, enhancing the overall data analysis experience and aiding in swift decision-making. It has built-in security features and extensive API capabilities, can easily be shared with global partners, and offers localization options in ten major languages.
What is AWS SPICE?
AWS SPICE, or Super-fast, Parallel, In-memory Calculation Engine, is the powerful in-memory engine that drives Amazon QuickSight. Designed to handle advanced calculations efficiently, SPICE enhances data analytics performance by rapidly processing and serving data.
Key Features:
- Speed: Optimized for speed, SPICE can execute complex queries and return results in seconds.
- Parallel Processing: It utilizes parallel processing techniques to handle multiple tasks concurrently, ensuring efficient data handling.
- In-Memory Storage: By storing data in-memory, SPICE minimizes latency and accelerates data retrieval.
- Encryption: For security, data stored within SPICE is encrypted at rest, ensuring your information remains protected.
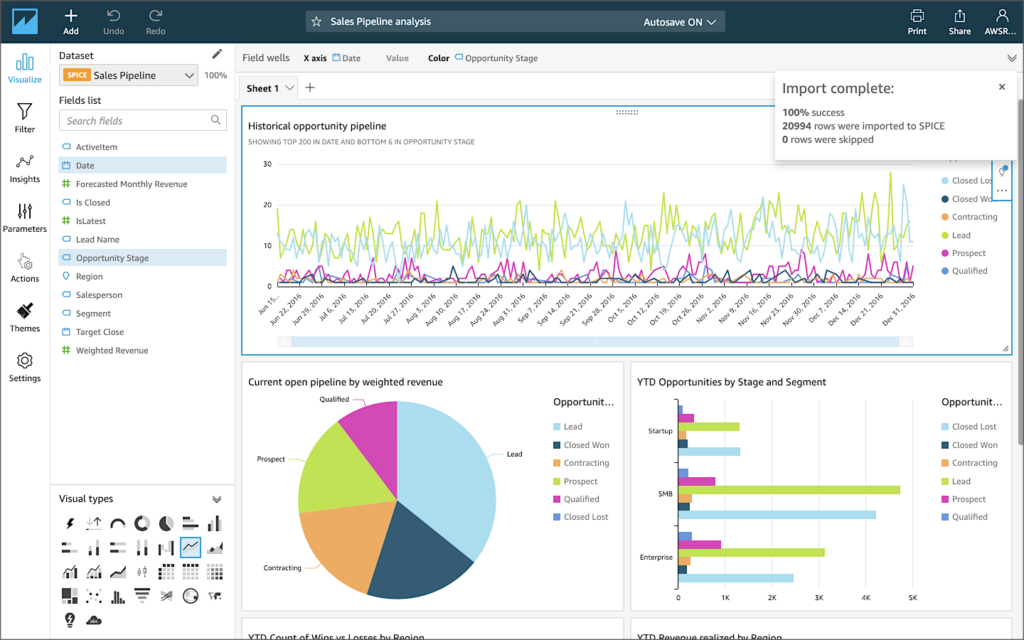
Build Customizable Dashboards
Users can create dashboards that are pixel-perfect and customized for specific use cases. QuickSight offers interactive tools, including graphs, tables, charts, stories, and sheets, enhancing the overall data analysis experience and aiding in swift decision-making. The service also supports on-the-go access via iOS, Android, and mobile web.
- Customization: Dashboard design that is pixel-perfect for customized, use-case-specific dashboards.
- Communication: Send customized email reports and alerts to end users.
- Accessibility: QuickSight's mobile access ensures you can stay informed anywhere.
Leverage ML Integrations for Insights
QuickSight integrates machine learning capabilities directly into the dashboard experience. Features like real-time Anomaly Detection, business metric forecasting, and interactive what-if scenarios are available through simple point-and-click interfaces. Auto-Narratives can be customized and woven into dashboards, providing users additional context.
- Anomaly Detection: Analyze all your data in real-time for anomalies and variations.
- Forecasting: Forecast business metrics and run interactive what-if scenarios.
- Auto-Narratives: Customizable narratives that provide more context within dashboards.
Enable True Self-Service BI for Everyone
QuickSight democratizes data analytics by enabling self-service BI capabilities. The Q feature allows end users to delve deep into data by asking simple questions without requiring BI training. Its 100% web-based authoring interface makes it easy to analyze data visually.
- User-Friendliness: Q allows end users to explore data with simple questions.
- Web Interface: 100% web-based authoring for easy visual analysis.
- Integration: Embed QuickSight capabilities into applications to provide data-driven user experiences.
Amazon EMR
EMR is what will help users scale these big workloads. It is flexible, incredibly simple to use, and is compatible with different storage types from either the AWS catalog or otherwise depending on the need and functionality of an application. Amazon EMR can procure any number of clusters, automatically configure them for specific frameworks, and provide extensive control to users on how to optimize them fully.
Open Source Applications
Clusters with EMR will automatically adapt to the users’ open-source applications of choice. Open-source data tools from the Apache catalog are available but are mostly confined to Spark, Hadoop, and HBase. Alternatively, Presto is an SQL query engine that is optimized for low-latency data analysis, also capable of supporting multiple operations.
Big Data Tools
Data scientists can get ample use out of EMR with its extensive support of deep learning and machine learning tools such as Hadoop applications. For more specific cases, users can add specific libraries or tools through the use of bootstrapping. Data analysts will frequently use the EMR Studio, Notebooks, and Hue for more interactive development, authorizing certain Apache jobs, and submitting SQL queries. EMR provides a solid data pipeline for development and processing while simplifying data management and privacy significantly.
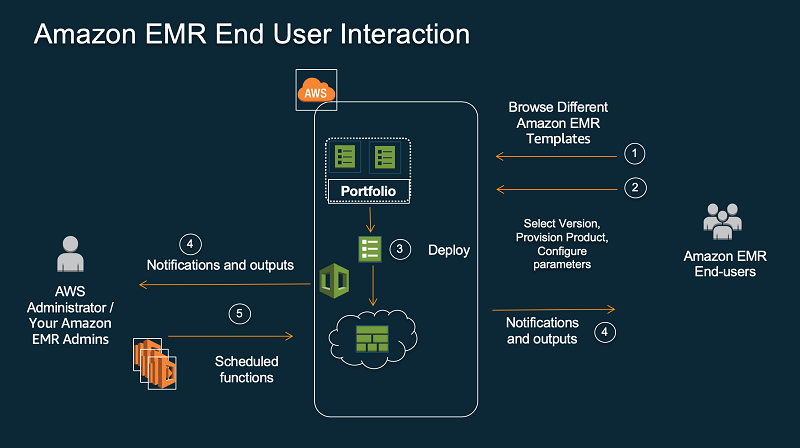
Internal Security Services
With the sensitive nature of the data being processed, there are a few options for how users can protect their data. AWS Lake Formation allows the implementation of authorization policies for accessing databases, columns, and tables. If Apache tools are preferred, EMR does allow the native integration of Apache Ranger to dictate how authorizations are distributed. Apache Ranger does offer distinct controls for access at individual levels. Then there is EMR’s User Role Mapper for users who are more familiar with the controls offered by AWS Identity Access Manager. Permission configuration can be done either between individuals or groups of users.
Hybrid Infrastructure
AWS Outposts extends services, infrastructure, and APIs to virtually any data center, location, or physical infrastructure capable of hosting the necessary software. Using the same Command Line Interface or Management Console for controlling the EMR, users can deploy using Outposts to whatever they need.
Efficient Data Processing
AWS provides a good number of tools a company could need if the company objectives required them to orient business structure around the cloud. Amazon has already adapted their environment to process heavy workloads and massive amounts of data and it is possible to set up a work cycle to continuously process data at the end of a transaction or data gathered from customer interactions for further refining that cycle. Adjustments can be made both more accurately and significantly faster compared to other business intelligence solutions.
Billing
AWS QuickSight does benefit from AWS' Free Tier category. New users can use a 30-day free trial for the Enterprise Edition of AWS QuickSight. This trial waives the typical $250/month base fee, allowing you to explore its features without any upfront costs. Once the trial period ends, pricing is based on usage. You’ll typically incur charges based on the number of users and the amount of data processed.
Amazon QuickSight is available in two primary editions, each catering to different user needs and offering distinct pricing structures:
Standard Edition: Designed primarily for personal use, such as individual data analysis and exploring datasets. This edition is accessible to those publishing dashboards or creating content, commonly referred to as authors. The pricing for the Standard Edition is set at $9 per month if paid annually or $12 monthly.
Enterprise Edition: This edition is aimed at larger organizations with more extensive data analytics and dashboard consumption requirements. It supports not only authors but also readers. For authors, the cost is $18 monthly with an annual agreement or $24 month-to-month. Readers are charged $5 per month per user. Additionally, a specific pricing option for high-volume usage costs $250 per month for every 500 reader sessions.
These options provide flexibility depending on the scale of use and the specific needs of the user, ranging from individual professionals to large enterprises.
AWS BI Tools at a Glance: The Full Ecosystem
AWS offers a layered business intelligence stack. No single tool does everything — instead, each service handles a specific part of the pipeline from raw data ingestion to interactive dashboards. Understanding how they fit together is the first step to choosing the right combination for your workload.
- Amazon QuickSight — Cloud-native BI and dashboarding. Best for interactive visualizations, embedded analytics, and self-service reporting.
- Amazon Athena — Serverless SQL query engine. Analyzes data directly in S3 without loading it into a database first. Pay per query.
- Amazon Redshift — Petabyte-scale cloud data warehouse. Best for structured, high-volume analytical workloads requiring consistent query performance.
- AWS Glue — Serverless ETL and data catalog. Prepares and transforms data before it reaches your BI layer. Critical for keeping datasets clean and queryable.
- Amazon EMR — Managed big data platform running Apache Spark, Hive, and Presto. Best for large-scale data processing and custom transformation pipelines.
Most production BI architectures on AWS combine at least three of these: Glue for transformation, Redshift or Athena for querying, and QuickSight for visualization. The right mix depends on your data volume, query frequency, and whether your team leans toward SQL or code-first workflows.
AWS BI Tools Compared: Pricing, Strengths, and Trade-offs
Each AWS BI tool has a distinct pricing model and a distinct role. Here is a direct comparison across the five core services.
- Amazon QuickSight — $24/user/month (Authors), $0 read-only (Readers pay per session, capped at $5/month). SPICE in-memory storage included up to 10 GB per user. Best for teams that need dashboards without managing infrastructure.
- Amazon Athena — $5 per TB of data scanned. No minimum, no setup cost. Cost drops significantly when data is stored in columnar formats like Parquet or ORC. Best for ad hoc queries against S3 data lakes.
- Amazon Redshift — Starts at ~$0.25/hour for dc2.large (on-demand). Serverless option available at $0.36 per Redshift Processing Unit (RPU) hour. Reserved instances reduce cost by up to 75%. Best for recurring, complex queries on structured warehouse data.
- AWS Glue — $0.44 per DPU-hour for ETL jobs. Glue Data Catalog billed at $1 per 100,000 objects stored (first million free). Best used as a pipeline complement to Athena or Redshift, not a standalone BI tool.
- Amazon EMR — EC2 instance cost plus EMR fee (roughly $0.048/hour on top of underlying instance cost for m5.xlarge). Spot Instances can reduce total cost by 60–80%. Best for data engineering teams running Spark or Hadoop pipelines at scale.
Note: All pricing reflects AWS public rates as of mid-2026. Costs vary by region — us-east-1 is typically lowest. Always verify current rates at aws.amazon.com/pricing before budgeting.
AWS QuickSight vs Tableau vs Power BI vs Looker
Most teams evaluating AWS BI tools are also considering Tableau, Power BI, or Looker. Here is how QuickSight — AWS's primary visualization layer — compares directly to each.
- QuickSight vs Tableau — Tableau has a deeper visualization library, stronger calculated field support, and a larger community. QuickSight wins on cost (Tableau Creator licenses run $75/user/month), native AWS integration, and zero infrastructure management. If your data is already in Redshift or S3, QuickSight connects in minutes. Tableau requires more setup but rewards teams with complex, custom visualization needs.
- QuickSight vs Power BI — Power BI Pro is $10/user/month, making it cheaper for Microsoft-heavy shops. Power BI has tighter integration with Azure, Teams, and Excel. QuickSight is the stronger choice when your stack is AWS-native — it avoids cross-cloud data transfer costs and latency. Power BI's row-level security model is more mature for enterprise governance scenarios.
- QuickSight vs Looker — Looker (now part of Google Cloud) uses a semantic modeling layer (LookML) that enforces metric consistency across your organization. QuickSight lacks an equivalent. If your organization needs a single source of truth for business metrics with governed definitions, Looker is worth the premium ($3,000+/month minimum). QuickSight suits teams that want fast, self-service dashboards without a modeling layer.
The honest trade-off: QuickSight is the right default if you are already on AWS and want low overhead. Bring in Tableau or Looker when your team outgrows self-service or needs enterprise governance that QuickSight does not yet offer.
Supported Data Source Connectors
Before committing to any AWS BI tool, confirm it connects to your existing data sources. Here is the current connector landscape across the primary services.
Amazon QuickSight native connectors include:
- Amazon Redshift, Athena, S3, Aurora, RDS (MySQL, PostgreSQL, MariaDB, SQL Server, Oracle)
- Salesforce, Adobe Analytics, GitHub, ServiceNow, Twitter
- Snowflake, Databricks (via JDBC)
- Any ODBC/JDBC-compatible database through custom connectors
- Excel and CSV file uploads directly into SPICE
Amazon Athena queries data stored in S3 in formats including CSV, JSON, Parquet, ORC, Avro, and Textfiles. Federated query connectors extend Athena to query DynamoDB, Redshift, DocumentDB, and external JDBC sources without moving data.
Amazon Redshift supports direct JDBC/ODBC connections from most major BI tools including Tableau, Power BI, Looker, and QuickSight. Redshift Spectrum allows external tables querying S3 data directly, bridging the warehouse and data lake layers.
AWS Glue includes a data catalog that registers connections to over 100 data sources, including on-premises databases via JDBC, Amazon DynamoDB, Kafka, Kinesis, and third-party SaaS platforms through AWS Marketplace connectors.
If your primary data lives outside AWS — in Snowflake, an on-premises Oracle database, or a SaaS platform like HubSpot — verify connector availability before assuming QuickSight covers your use case. AllCode can audit your current data landscape and map it to the appropriate AWS toolchain.
Which AWS BI Tool Should You Use? A Decision Framework
Use this framework to match your situation to the right tool — or combination of tools.
- You need dashboards for non-technical stakeholders → Amazon QuickSight. Low setup cost, self-service interface, pay-per-session reader pricing keeps costs predictable at scale.
- You need to query a data lake in S3 without building a warehouse → Amazon Athena. No infrastructure to manage. Query immediately. Cost scales with usage, not with provisioned capacity.
- You run recurring complex queries on structured data and need consistent sub-second response times → Amazon Redshift. Provisioned or serverless. Works best when query patterns are known and frequent enough to justify warehouse costs.
- Your raw data is messy, inconsistently formatted, or spread across multiple sources → AWS Glue first. Build your ETL pipelines in Glue before connecting any visualization layer. Skipping this step creates unreliable dashboards.
- Your team runs custom Spark jobs or large-scale ML preprocessing → Amazon EMR. Managed clusters with full control over the runtime environment. Best for data engineering teams, not business analysts.
- You need an end-to-end AWS-native BI stack → Glue + Athena or Redshift + QuickSight. This is the most common production architecture AllCode deploys for mid-market and enterprise clients.
If you are unsure which tier applies to your workload, the decision usually comes down to two variables: query frequency and data structure. Ad hoc queries on unstructured data → Athena. High-frequency queries on clean warehouse data → Redshift. Visualization on top of either → QuickSight.
Real-World Use Cases for AWS BI Tools
Understanding how organizations actually deploy these tools helps clarify when each service earns its cost.
- E-commerce revenue reporting (QuickSight + Redshift) — A retail company loads daily transaction data into Redshift via scheduled Glue jobs. QuickSight dashboards surface revenue by channel, product, and region. Finance and marketing teams access read-only views without requiring data analyst involvement for every report. Reader session costs stay under $2/user/month at typical usage.
- Ad hoc log analysis (Athena + S3) — A SaaS platform stores application logs in S3 in Parquet format. Engineers run exploratory SQL queries through Athena to investigate incidents or product usage patterns. No cluster to provision — queries run in seconds and cost fractions of a cent at typical log volumes.
- Data lake modernization (Glue + Athena + QuickSight) — A healthcare organization migrates from an on-premises data warehouse to an AWS data lake. Glue crawlers catalog incoming data from multiple clinical systems. Athena provides a SQL interface for analysts. QuickSight delivers dashboards to department heads — all without provisioning a single server.
- Large-scale ML feature engineering (EMR) — A financial services firm runs Apache Spark jobs on EMR to process hundreds of millions of transaction records daily, generating feature sets for fraud detection models. Spot Instances reduce compute costs by 70% compared to on-demand pricing.
AllCode has deployed AWS BI stacks across healthcare, fintech, logistics, and SaaS. The architecture varies, but the principle is consistent: match the tool to the job, and minimize the number of services to only what the workload requires.