
Which Metrics to Monitor for you Elastic Beanstalk Environment
We’ve seen a number of poorly configured Elastic Beanstalk environments. Most people believe that if your Elastic Beanstalk instances run into problems, then AWS will just spin up new instances. This is partially correct. Elastic Beanstalk enables you to configure scaling based upon a single metric, but what happens if the problem isn’t with that metric? Well, unfortunately, everything can go to hell.
Our recommendation is to add the following metrics to all of your AWS Elastic Beanstalk environments:
- EnvironmentHealth
- ApplicationRequestsTotal
- ApplicationRequests5xx
- ApplicationRequests4xx
- ApplicationLatencyP99
Yes, there’s cost associated with adding these 5 metrics to your AWS environment, but, in our opinion, the costs are well worth it.
ElasticBeanstalk_Metrics_Cost_Estimate.pdf
- EnvironmentHealth
The most basic Beanstalk metric is EnvironmentHealth, which is an enumeration containing the 7 Beanstalk health statuses as follows:
- 0 – OK
- 1 – Info
- 5 – Unknown
- 10 – No data
- 15 – Warning
- 20 – Degraded
- 25 – Severe
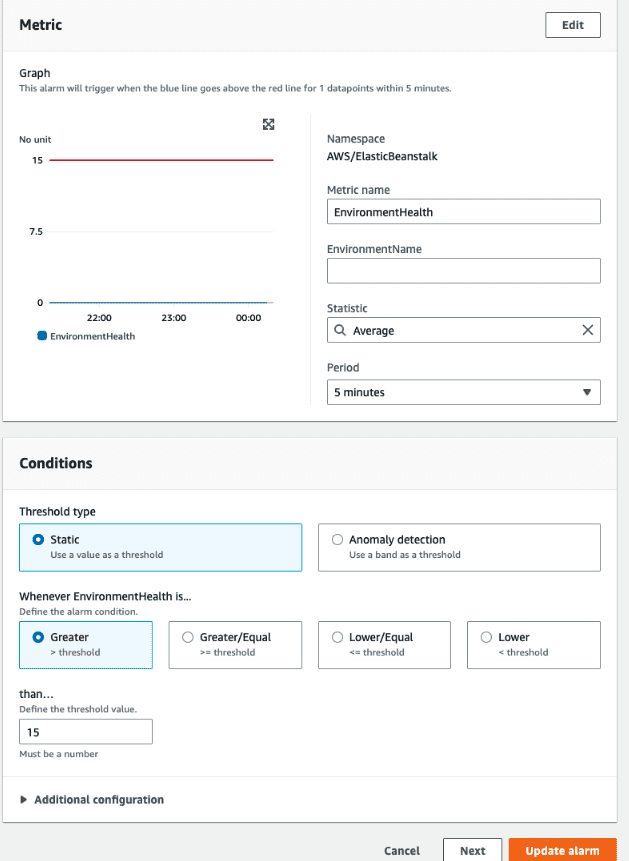
Recommendation: Monitor and create an alarm for anything >= 15 (Warning)
The Cloud Watch Alarm will be specified in the CloudWatch > Alarms section. Typically, the Alarm will be configured on the Metric name: EnvironmentHealth for the appropriate environment. The statistic will be set to average over a 5 minute period. We’ll configure the conditions to be Static, Greater than 15.
Next, when the Alarm state trigger is in Alarm, we’ll select an existing SNS Topic to post to. We’ll also specify an Email endpoint to receive the notification.
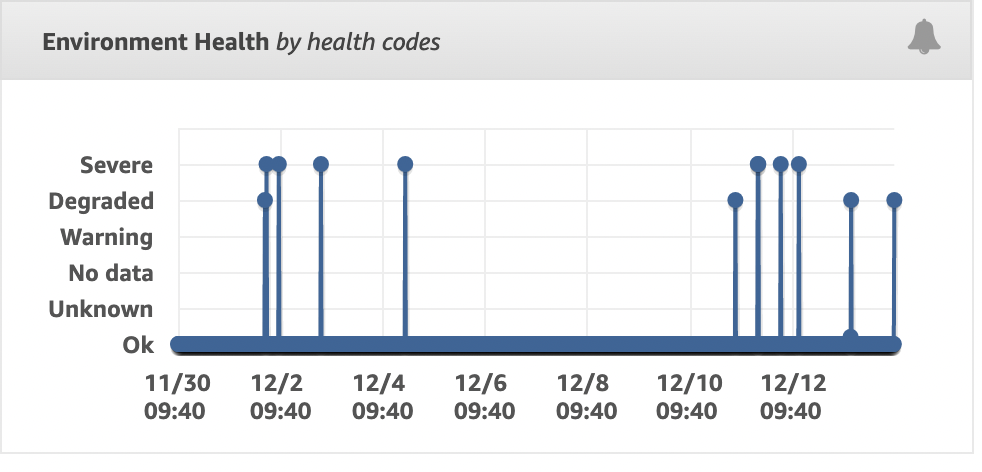
In most Elastic Beanstalk environments, we see see multiple degradations within a two week period as seen below
- ApplicationRequestsTotal
- ApplicationRequests5xx
- ApplicationRequests4xx
Beanstalk measures metrics about the number of requests your application is receiving, as well as the status codes of the responses. Monitoring the total number of requests can help you pinpoint surges in traffic, while monitoring 5xx and 4xx responses is good error detection.This metric is measured for both environments and instances, and we want to monitor the environment version.
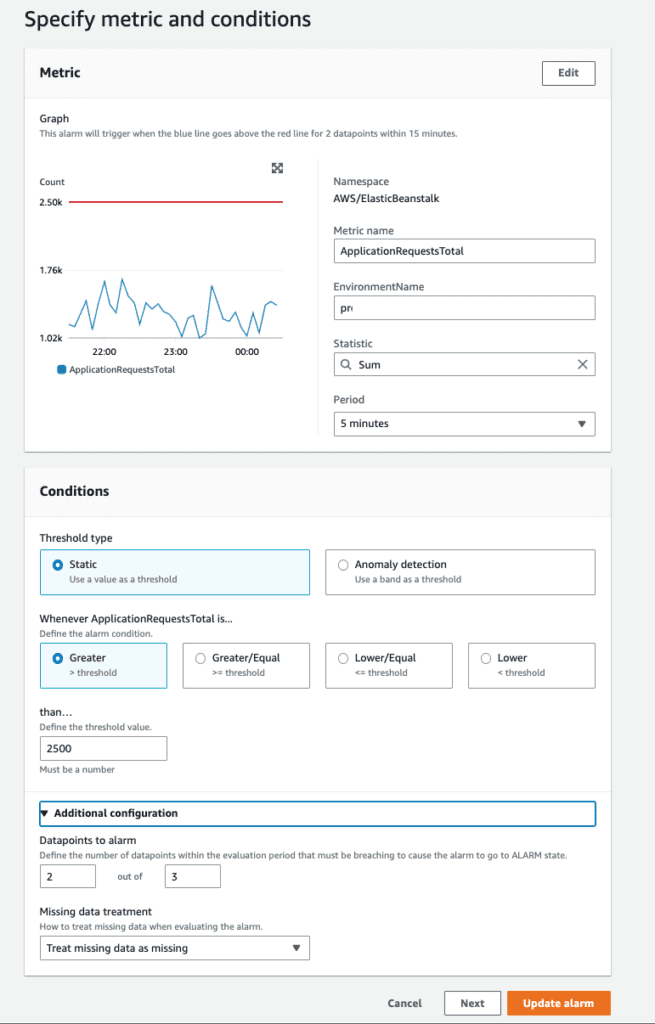
Recommendation: Monitor and create an alarms on ApplicationRequestsTotal, ApplicationRequests5xx, and ApplicationRequests4xx on the Sum statistic for each metric.
These sums will be different per environment. For example, for some applications, 2,500 requests within a 5 minute period will be a lot of requests triggering an alarm
- ApplicationLatencyP99
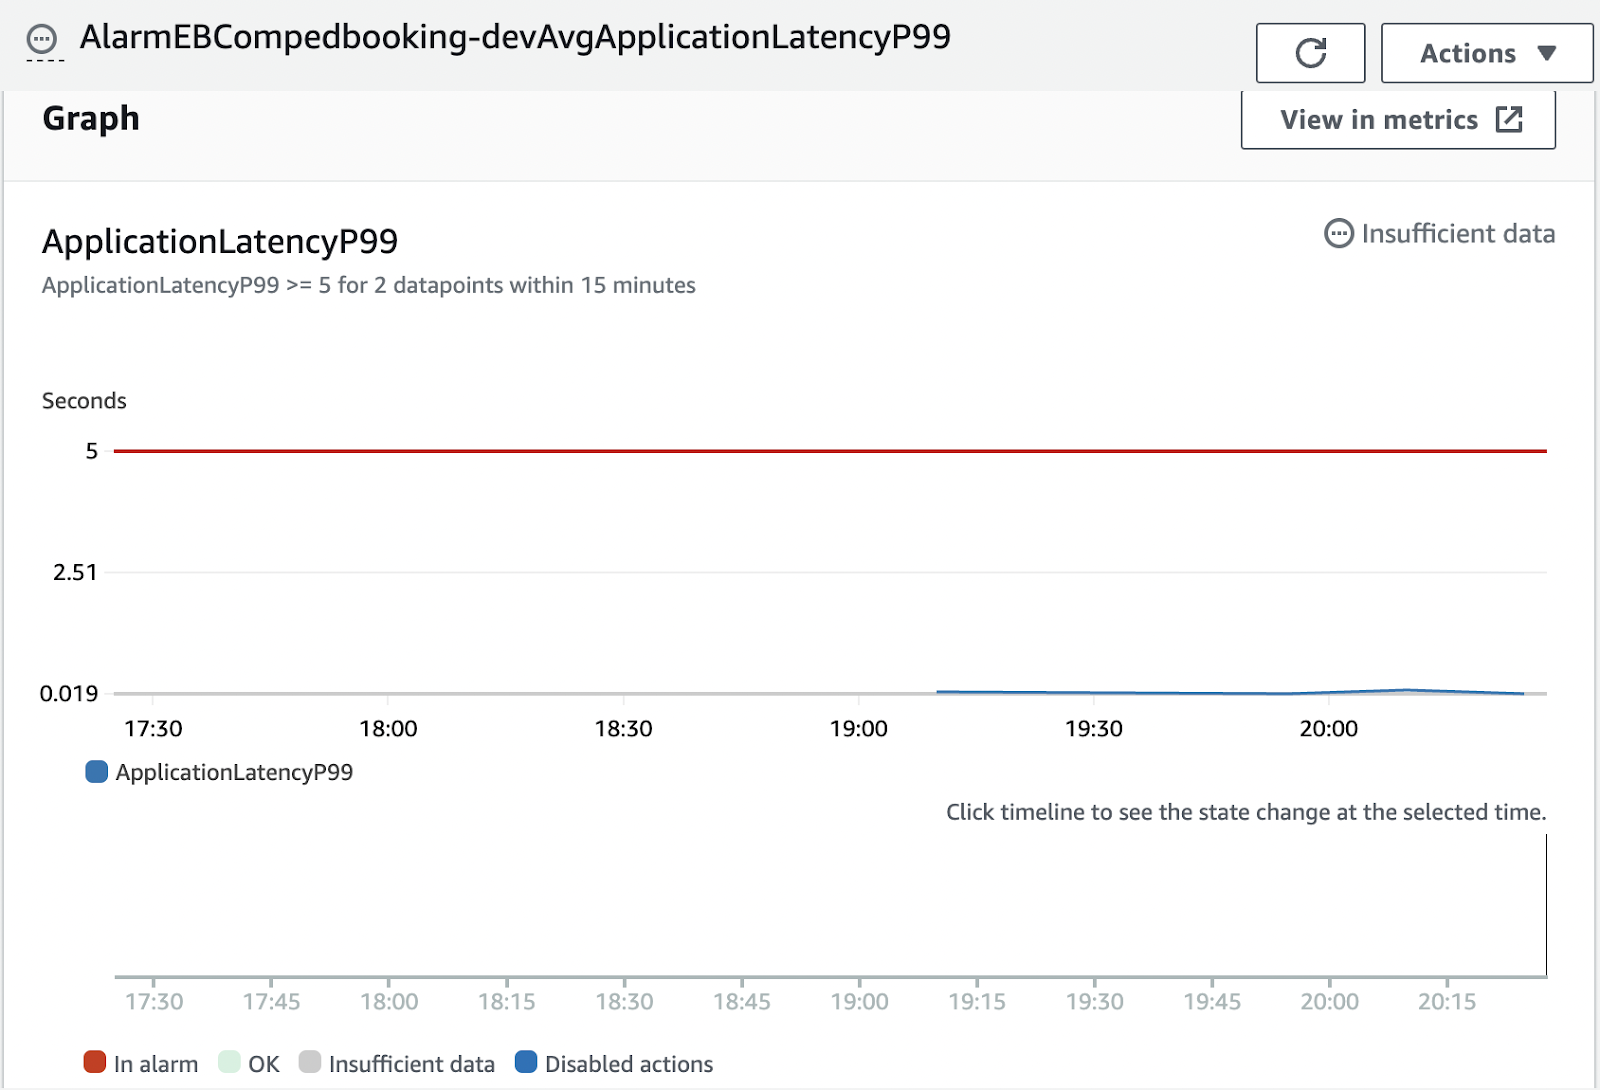
ApplicationLatencyP99 measures 99th percentile for application latency, and can be useful to detect when your application’s performance is suffering. When latency increases, it often means that other issues are imminent. This metric is measured for both environments and instances, and we want to monitor the environment version.
Recommendation: Monitor ApplicationLatencyP99, create a CloudWatch alarm on the Average statistic.
We typically will deploy these 5 metrics to each environment. When these metrics go into an alarm state, we’ll have the alarm invoke the appropriate SNS topic.
Instance Metrics
While monitoring instance metrics can yield some very helpful alerts, if there is any sort of autoscaling or instance rotation in the environment, creating alarms will be ineffective. Any instance you create an alarm on will eventually be removed and replaced — but your alarm won’t!