Data Visualization Explained
Data visualization is the practice of representing data in visual or graphical formats to extract insights, identify patterns, and communicate information effectively. By transforming raw data into intuitive charts, graphs, maps, and dashboards, data visualization allows users to comprehend complex datasets at a glance. Through the strategic use of colors, shapes, and interactivity, data visualization enables stakeholders to explore trends, correlations, and outliers, leading to informed decision-making across various industries and disciplines. Whether analyzing sales figures, monitoring performance metrics, or tracking global trends, data visualization serves as a powerful tool for uncovering actionable insights and driving organizational success in today’s data-driven world.
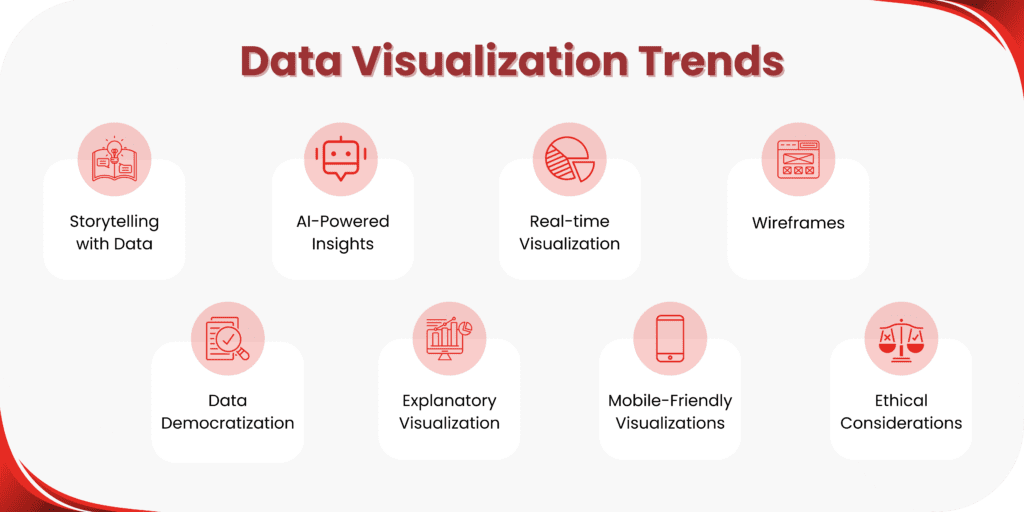
In 2024, data visualization is undergoing profound changes driven by advancements in AI, real-time analytics, and mobile-friendly solutions. AI automates insights, while real-time analytics enables swift responses to evolving trends. Mobile optimization facilitates on-the-go data access, and user-centric design empowers non-technical users to understand data effortlessly. Additionally, ethical considerations ensure fair representation, fostering trust and integrity in decision-making processes. Overall, 2024’s data visualization landscape prioritizes innovation, accessibility, and ethics to drive informed decision-making in an ever-evolving digital world.
As an advanced AWS partner, we bring unparalleled expertise to architect, deploy, and optimize cloud solutions tailored to your unique needs.
Top Data Visualization Trends in 2024
1. AI Data Visualization: Redefining Insights with Artificial Intelligence
The synergy between AI and data visualization has reached new heights, revolutionizing how we interpret and derive insights from complex datasets. AI-powered algorithms facilitate automated data analysis, enabling businesses to uncover hidden patterns and trends effortlessly. Whether it’s predictive analytics or sentiment analysis, AI-driven data visualization empowers decision-makers to make informed choices swiftly and efficiently.
2. The Future of Data Visualization: Trends Shaping Tomorrow’s Insights
As we gaze into the future of data visualization, one cannot overlook the transformative trends reshaping the landscape. From immersive storytelling to real-time analytics, the future promises a myriad of possibilities for visualizing data in innovative and compelling ways. Harnessing these trends unlocks new avenues for extracting actionable insights and driving informed decision-making.
3. Dynamic Data Visualization: Embracing the Power of Real-Time Insights
In an era defined by data velocity, real-time visualization emerges as a game-changer, offering unparalleled agility in monitoring trends and identifying anomalies. Through dynamic dashboards and interactive visualizations, organizations gain real-time visibility into their data, empowering them to respond swiftly to evolving trends and market dynamics.
4. Structural Brilliance: Wireframes Paving the Path to Polished Designs
Before embarking on the journey of data visualization, laying a solid foundation is paramount. Wireframing serves as the cornerstone of design, enabling stakeholders to outline the structure and functionality of visualizations iteratively. By leveraging tools like Mokkup.ai, designers refine the visual and interactive aspects of dashboards collaboratively, ensuring a seamless transition from concept to execution.

5. Democratizing Data: Empowering the Masses with Self-Service Visualization
The democratization of data visualization heralds a new era of accessibility, empowering non-technical users to explore and understand data independently. Intuitive visualization platforms and storytelling tools bridge the gap between data and decision-making, enabling individuals across various domains to leverage data-driven insights for strategic initiatives.
6. Unveiling Complexity: Explanatory Visualization for Deeper Understanding
As datasets grow in complexity, explanatory visualization emerges as a beacon of clarity, unraveling intricate relationships and causal pathways. Interactive explanations and statistical significance indicators facilitate a deeper understanding of data patterns, empowering users to draw meaningful conclusions with confidence.
7. Mobile-First Approach: Visualizations for an On-the-Go World
With the pervasive adoption of mobile devices, data visualization transcends traditional boundaries, offering insights anytime, anywhere. Mobile-optimized visualizations and interactive dashboards empower users to make informed decisions on the fly, driving agility and responsiveness in a fast-paced digital landscape.
8. Ethical Imperatives: Promoting Transparency and Trust in Data Representation
As data assumes a central role in decision-making, upholding ethical standards in data representation becomes paramount. Data visualization tools must prioritize transparency and fairness, avoiding biases and misrepresentations that could erode trust and undermine the integrity of insights.
Conclusion
In conclusion, the future of data visualization is shaped by a trifecta of innovation, accessibility, and ethical responsibility, ushering in a new era of data-driven decision-making. Embracing emerging trends and technologies allows organizations to harness the full potential of data visualization tools, empowering stakeholders to derive actionable insights and make informed choices with confidence. As we navigate the intricacies of an interconnected world, data visualization serves as a beacon of clarity, guiding us through the maze of information overload towards meaningful insights and innovative solutions. By prioritizing transparency, fairness, and accountability in data representation, we not only foster trust but also pave the way for a more inclusive and responsible use of data visualization in shaping the future of industries and societies alike. In this ever-evolving landscape, data visualization continues to play a pivotal role in illuminating pathways to insights and innovation, driving progress and transformation across diverse domains and disciplines.
Get Started Today!
At AllCode, our mission is to leverage our unique skillset and expertise to deliver innovative, top-tier software solutions that empower businesses to thrive in our world’s rapidly-evolving technological landscape.
Work with an expert. Work with AllCode


