Due to digital transformation, there has been a considerable increase in the amount of data generated and collected worldwide. Thanks to the amount of data about our internal processes and our customers’ behaviors today, organizations now have the aptitude to make better decisions and drive growth faster than ever before.
We now can leverage more information of better quality at a lower cost to make use of more information. As a prime example, customer behavior profiling can give businesses a wealth of information about their customers, including their everyday lives, how they use products, and which aspects of those products they value the most.
Data Analysis Pipeline
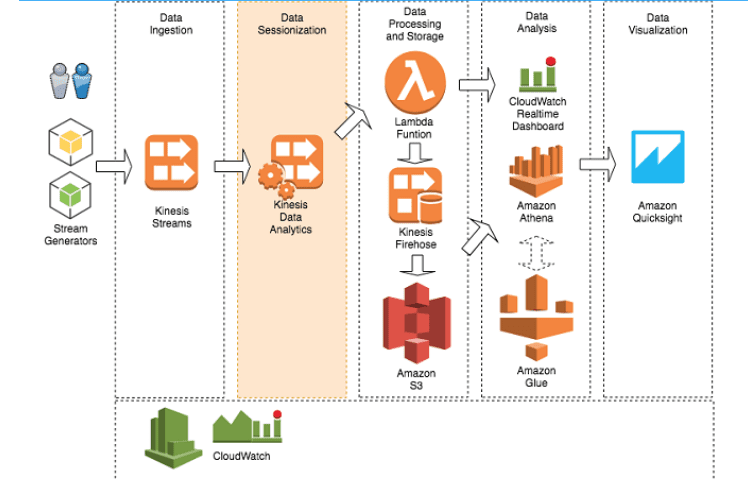
To collect, store, and analyze data, we must undertake a deep dive into four basic principles. These four components are crucial, regardless of the project or implementation: Data collection, data lake/storage, data processing, and data analysis and visualization.
In most cases, a standard data analysis pipeline can be segmented into the following steps:
- The data from the field is collected (ingested) by an appropriate infrastructure.
- The data is saved to an appropriate data storage service to provide easy access to data.
- Then the storage service sends data to the computer to be processed, which performs the appropriate processes and stores the data in another location.
- The processed information is used to create visual representations in business intelligence (BI) tools. These tools offer data visualizations and are helpful for end-users and the organization.
Moving forward, we will break down each of the pipeline steps and discuss the relevant AWS services you can use to implement the steps with ease.
1. Collection
Before you use a template or a standard data collection system, you should consider a list of various criteria. For example, this list might include the data features and expectations of latency, cost, and durability.
The most important thing to remember is how often you plan to ingest data regarding the data flow. Additionally, it may be called the “temperature” of the data (in terms of its state, i.e., hot, warm, or cold).
To decide the type of infrastructure, one should consider the frequency of the input data. For transactional data (SQL), technologies like AWS Database Migration Service are useful. At the same time, you can also use Amazon Kinesis Data Streams and Kinesis Firehose for either real-time or near real-time data streams.
AWS Kinesis Data Streams
Amazon Kinesis Data Streams collects massive volumes of data securely, consistently, and inexpensively. In addition, it’s incredibly flexible, as you may use bespoke software to get it to fit your exact specifications. The unit can hold data for up to 7 days and may accommodate many applications to utilize the same flow of information.
AWS Kinesis Data Firehouse
Amazon Kinesis Data Firehose eliminates the tedious manual processes that Kinesis Data Streams necessitates having complete control over much of what Kinesis Data Streams does. Kinesis Data Firehose also has no-code configuration options to distribute data to other AWS services.
It allows us to group the data into batches easily and aggregate the information. In addition, Kinesis Data Firehose has several options for dealing with output: Kinesis Data Streams, Amazon S3, Amazon Redshift, and Amazon ElasticSearch can all handle streams produced by Kinesis Data Firehose.
Cold data obtained by applications that can be batch-processed regularly can be successfully collected using Amazon EMR or AWS Glue.
You also need to consider the volume of data. One good indicator of the services that you can offer is the amount of data to be transported. It’s essential to know your “chunk size” of input data to create an ingestion infrastructure that is enough for handling your input data because certain services like Kinesis and SQS have limitations on item and record sizes.
There are limits on the overall volume size for certain AWS services. Therefore, during the design phase, you’ll need to understand the overall capacity of ingestion (how you can ingest many chunks of information at once) to select the capacity of your machines appropriately, the number of streams, and the network infrastructure.
Need a hand?
2. Data lake / storage
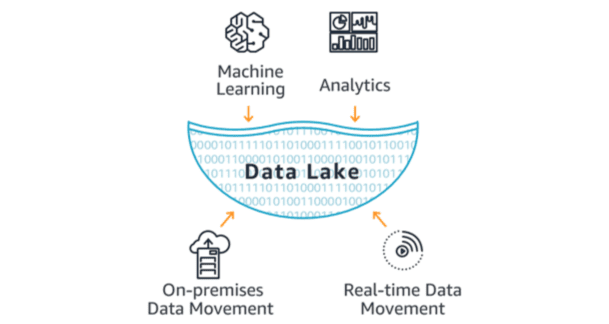
Next, you need to decide whether you’re processing data with a data lake or a data warehouse.
Amazon Redshift is one of the most popular choices for building a data warehouse on AWS.
With Redshift, you can access data warehouses, operational databases, and data lakes to run standard SQL queries on trillions of bytes of structured and semi-structured data. First, Redshift saves your query results in open formats such as Apache Parquet. Then, it quickly uploads them to Amazon S3, allowing you to use other Amazon services such as Amazon EMR, Amazon Athena, and Amazon SageMaker to analyze your data further.
When you build a data lake on Amazon S3, you may utilize native AWS services for performing big data analytics, AI, ML, HPC, and media data processing applications to do tasks like data discovery. For example, with Amazon FSx for Lustre, you can create Lustre file systems for HPC and ML applications, process big media workloads from your data lake, and launch Lustre file systems for processing HPC and ML workloads.
You can choose your favorite AI, ML, HPC, and analytics software from the Amazon Partner Network and have flexibility in its implementation. IT managers, storage administrators, and data scientists have much more freedom because Amazon S3 provides many tools and capabilities.
3. Processing
Raw data is of limited utility in the data analytics process. However, data analysts need to draw relevant conclusions from the data to drive better decisions. That’s why you must work to ensure that the data you send is quickly processed.
Data wrangling is another term for this. You can get a lot done: you can do many things at once and use your data in many ways. There are other ways to go about it, and data preparation is among those alternatives; with it, you may alter field names or data types, apply filters, or add calculated fields.
Preparing data is a task that many find challenging, yet it is crucial. Before analysis, you take data from different sources, clean it, convert it into a helpful format, and then load it into multiple data repositories for deeper examination.
Amazon provides many solutions to the many steps involved in the project. These include Amazon Kinesis Data Analytics, Amazon Sagemaker Preprocessing, Amazon EMR, and AWS Glue.
If you want to look at real-time and near real-time data, Kinesis will be your best friend. Amazon Kinesis Data Analytics is a handy tool for data transformation on streaming data, making SQL commands readily available for fundamental data transformations.
AWS Sagemaker
The Amazon Sagemaker Preprocessing feature makes it easy to run previously defined transforms jobs in EC2 instances that may be started on demand. By leveraging this process, you can easily clean and preprocess jobs on tiny datasets.
AWS EMR
Amazon EMR is a massive open-source software suite for data analytics and AI-driven big data that can process enormous data loads. It can also integrate with Apache Spark, Apache Hive, Apache HBase, Apache Flink, Apache Hudi, and Presto.
AWS Glue
AWS Glue is a serverless data integration service for preparing and combining data to support analytics, machine learning, and application development. Glue will assist you in quickly gathering data to be integrated with other sources, allowing you to analyze and make use of data in days instead of months. In addition, Glue is a Spark-based ETL tool for big datasets that uses PySpark to enable PySpark Jobs.
4. Analyzing and Visualizing
You must be able to visualize your data. Visually oriented data points are like picture frames: better representations of information than raw data alone. One of the main ways we comprehend what’s happening is to look for patterns. Often, these patterns are not evident unless we look at data that is presented in tables. Right visualizations can increase your ability to comprehend new concepts more quickly.
You should be clear about your objective before you start to design a chart or graph. Charts will display one of the following types of data: Key Performance Indicators (KPI), Relationships, Comparisons, Distributions, and Compositions.
Descriptive analysis
The descriptive analysis describes events that have occurred. The procedure relies on post hoc analysis and is more commonly referred to as “data mining.”
Diagnostic analysis
The Diagnostic analysis explains the situation by answering the question: “Why did it happen?” It concentrates on what we see in retrospect and foresight. One type of data analysis looks at historical data and then compares it to other data sources. One can trace dependencies and patterns to identify potential answers using this approach.
Predictive analysis
The predictive analysis predicts what will occur. Thus, it promotes intelligence and long-term planning. Descriptive and diagnostic analysis data are used in this sort of study to anticipate future events and trends.
This strategy is dependent on the correctness and consistency of the data condition it is being used to predict. The Predictive analysis helps the user determine their next move by answering, “What should I do?” Thus, it is concerned with prediction.
The data supplied is utilized to recommend specific actions. The predictive analysis relies on all other forms of analytics, constraint-based optimization, and applied rules to extract accurate predictions. The best thing about this kind is that it is easy to automate thanks to machine learning.
Cognitive and artificial intelligence
How should one go about accomplishing the recommended tasks? The Cognitive and artificial intelligence provide answers. It focuses on hypothesis input and planning.
This style of analysis emulates what the human brain does when it attempts to solve an issue. Systems that use data, connections, and limitations to build theories help in understanding information. The replies are given in the form of a ranking of confidence, accompanied by recommendations.
Wrapping it up
We’ve just scratched the surface of data analytics on AWS. If you’re interested in getting expert help with your analytics, reach out to us and we can give you a hand. AllCode is an AWS partner and has the breadth and depth to help you configure an effective data warehouse and data lake to gain the greatest insight into how your company and customers interact with your products and services.
Data Experts
AllCode is an AWS partner and has extensive experience working with datasets small, medium, and large. Get in touch with us and learn how we can help you leverage data to make better business decisions.
Related Articles
Business Owner’s Guide to DevOps Essentials
As a business owner, it’s essential to maximize workplace efficiency. DevOps is a methodology that unites various departments to achieve business goals swiftly. Maintaining a DevOps loop is essential for the health and upkeep of deployed applications.
How Gen AI Can Enhance the Finance Industry
Generative AI redefines how we view many mandatory but tedious tasks. It can be applied to not only content generation, but also application development. Here are some examples of how the finance industry can make use of it.
Top 10 Generative AI Companies and Platforms in 2024
Explore the top generative AI providers set to redefine technology in 2024. This article covers the fundamentals of generative AI and highlights the visionary companies driving its future. Traditional AI systems faced limitations, but the advent of generative AI has revolutionized the field, offering robust solutions for generating creative and complex outputs.

A self-motivated digital marketing specialist with 3+ years of experience advertising in the financial services industry.
While I wear several marketing hats, my primary focus is on content strategy and curation.
I aim to consistently challenge myself and position my skills toward personal and professional endeavors that lead to measurable results.
